Interactive Dashboards from notebooks with Voilà
See https://voila.readthedocs.io/en/stable/using.html for full Voilà documentation.
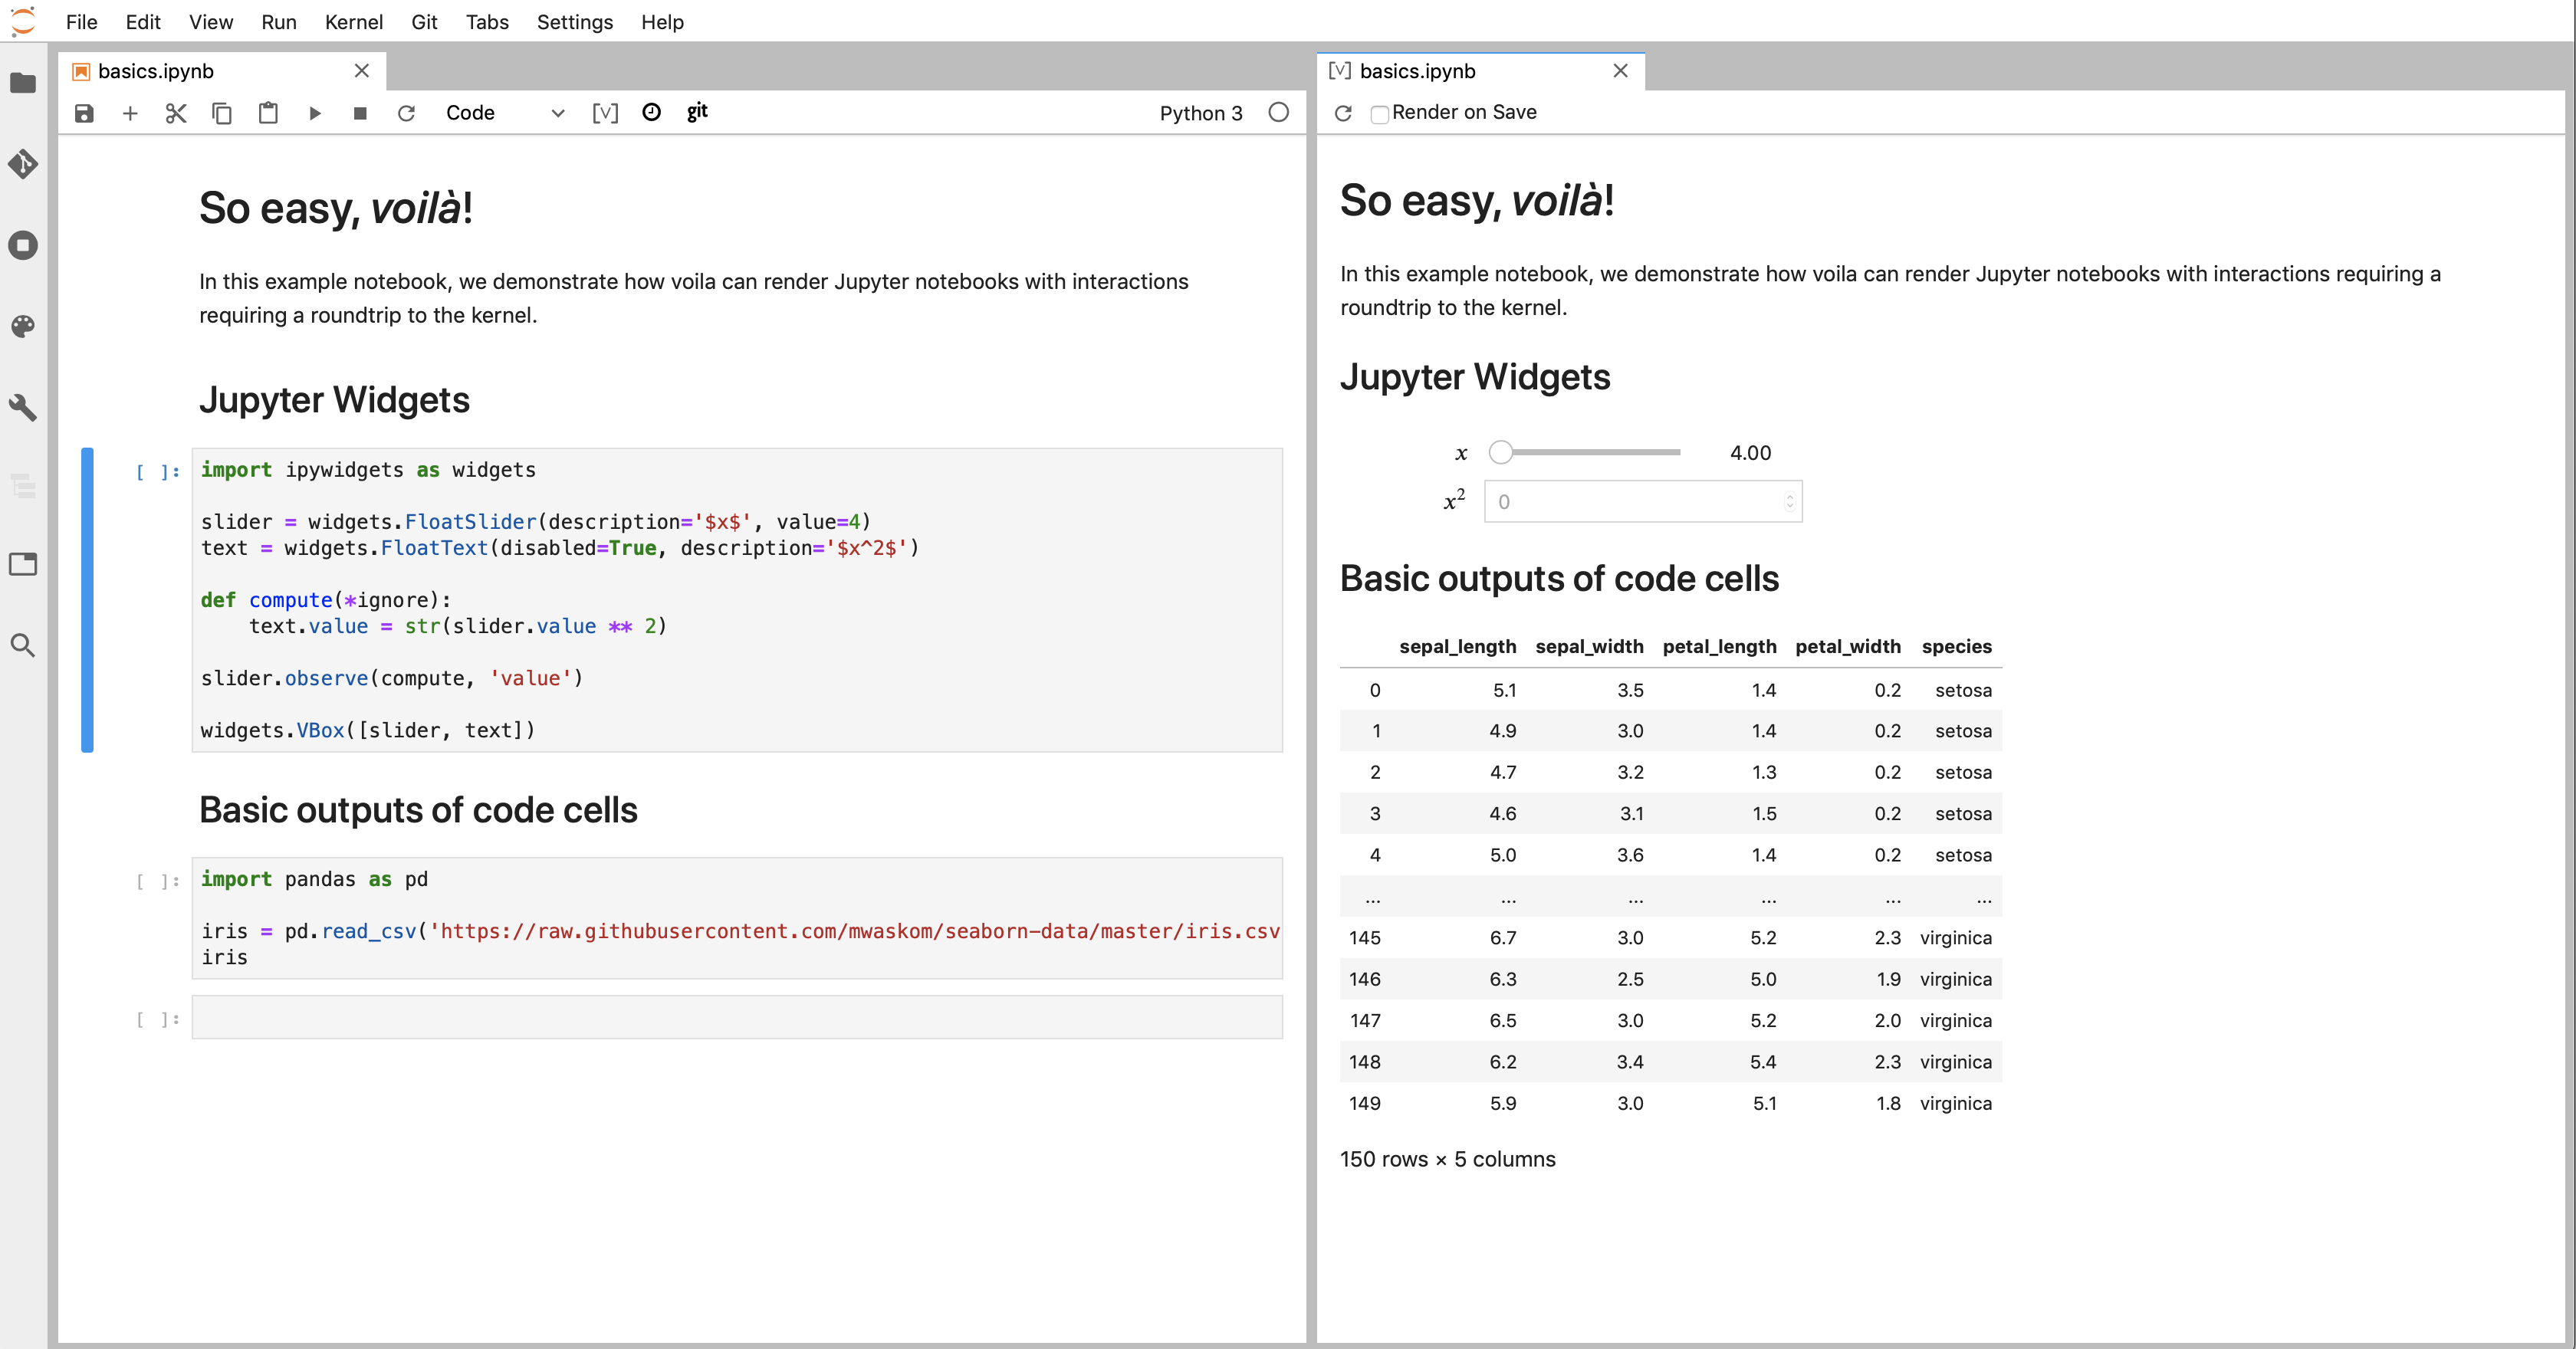
You can create interactive dashboards from Jupyter notebooks. Dashboards can be displayed in the new tab within Notebooks or in a new browser tab. This option is really great for presentations: you can show tables, images, interactive graphs while hiding the code. See example of Voilà dashboard below:
anaconda_cloud_1
To try some tutorial notebooks, clone voila git repo:
https://github.com/QuantStack/voila and open the notebooks
folder.
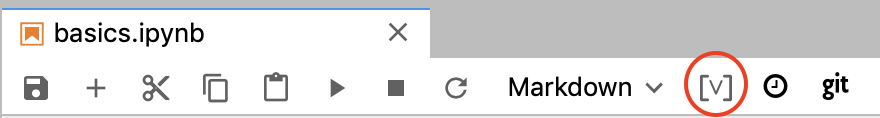
Render with Voilà in the new tab within Jupyter
While editing notebook, clcik on the ‘[v]’ button, as shown below:
anaconda_cloud_1
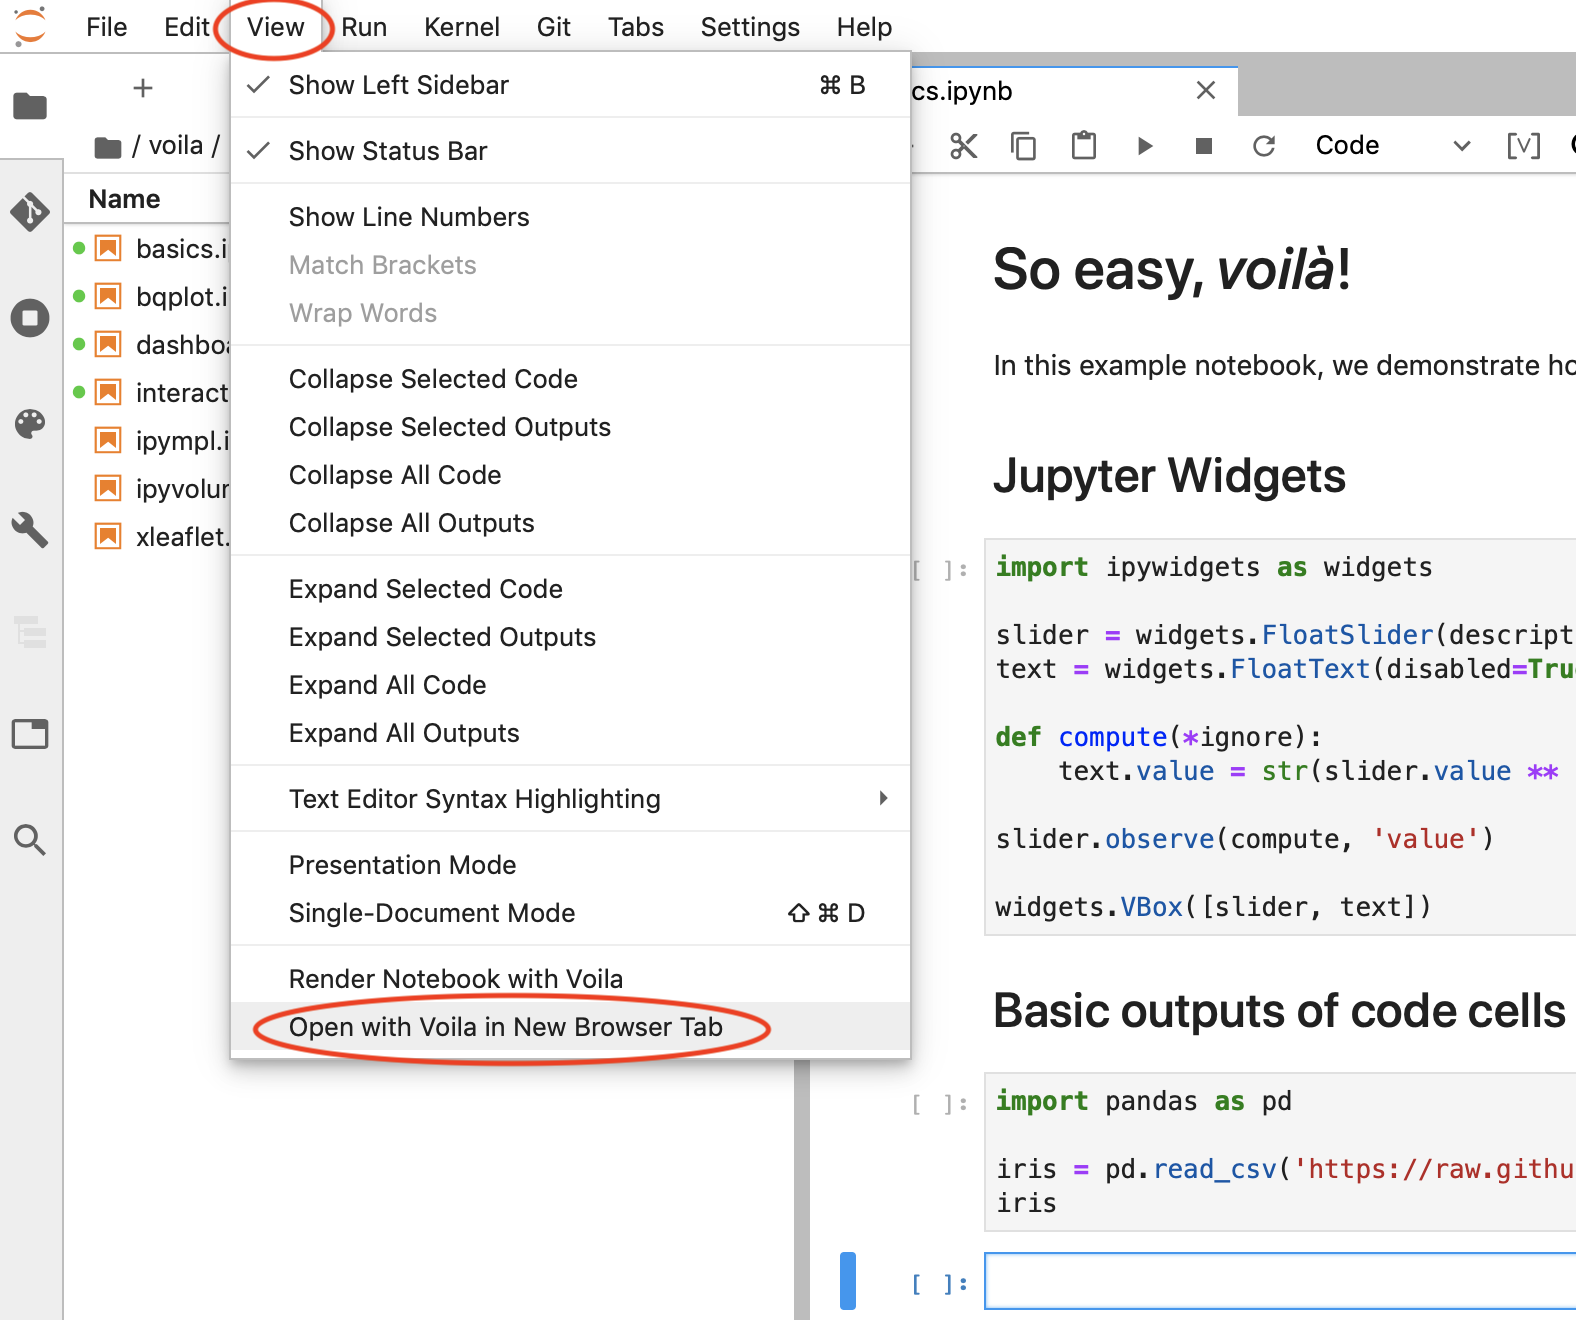
Render with Voila in the new browser tab
anaconda_cloud_1